



 Sophie Blake
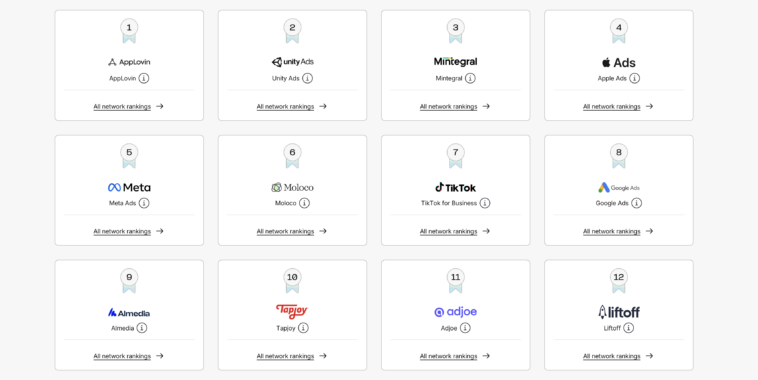
AppsFlyer has released its 2026 Performance Index, identifying AppLovin, Google Ads and Apple Ads as the leading mobile advertising platforms across different operating systems and app categories. The report analyzed 27.2 billion installs from nearly 25,000 apps, ranking 57 media sources based on advertising volume and performance-related indicators.
The analysis covers activity between April 2025 and June 2026, with separate global rankings for gaming and non-gaming applications on iOS and Android. According to AppsFlyer, AppLovin leads iOS gaming, Google Ads ranks first in both Android gaming and Android non-gaming, while Apple Ads holds the top position in iOS non-gaming.
In the iOS gaming category, AppLovin ranked first in both power and volume, with a power score 82% higher than second-place Unity Ads. Its volume score was also 70% higher than Mintegral, which ranked second by volume and third by power. Unity Ads secured second place in the power rankings despite ranking fifth by volume, while Apple Ads and Meta Ads completed the top five by power.
AppLovin also moved ahead of Apple Ads in iOS gaming volume, climbing one position compared with the previous edition. AppsFlyer noted that AppLovin had identified its AXON 2.0 advertising technology as a growth driver during its first-quarter earnings call. Meanwhile, Unity Ads gained two positions in volume, reaching fifth place, with AppsFlyer suggesting that the consolidation of ironSource demand onto Unity Ads may have contributed to the change.
On Android gaming, Google Ads maintained first place in both power and volume, recording a power score more than twice that of second-ranked AppLovin. Meta Ads ranked third by power, followed by Mintegral and Xiaomi. Although Mintegral placed fourth in the power rankings, it held second place by volume, ahead of AppLovin.
The report also identified increasing activity among Android device manufacturers’ advertising networks. Xiaomi climbed six positions to eighth place in Android gaming volume, representing the largest increase among the leading networks. OPPO and Vivo also improved their volume positions, reaching ninth and fourteenth place, respectively. The results indicate that OEM advertising channels are gaining a larger presence in mobile game distribution alongside established advertising platforms.
In non-gaming apps, Apple Ads led both the power and volume rankings on iOS, followed by Meta Ads in second place. Google Ads ranked third by power, while TikTok for Business and Snapchat occupied fourth and fifth place. AppLovin ranked sixth by power and fifth by volume, reflecting its presence outside the gaming segment.
The Android non-gaming rankings showed a different competitive structure. Google Ads held first place in both power and volume, followed by Meta Ads and TikTok for Business, which occupied the same positions across both measures. Digital Turbine (DT) ranked fourth by power despite placing thirteenth by volume, while Vivo completed the top five. AppsFlyer attributed DT’s position to its device-level distribution model, including applications preloaded through mobile carriers and device manufacturers. Vivo’s performance was linked primarily to finance applications in the Indian Subcontinent.
Beyond individual network rankings, AppsFlyer reported increased advertising expenditure across most major media sources. Nine of the top ten and 17 of the top twenty media sources recorded year-over-year increases in ad spend, alongside growth in attributed conversions and media costs. The trend was observed across both operating systems and in gaming and non-gaming categories.
The 2026 edition also introduces an important methodological change. AppsFlyer now calculates its power rankings using a combination of advertising volume and quarter-over-quarter changes in ad spend, replacing the retention-based quality indicator used in previous editions. The company considers changes in advertiser spending a signal of where marketing budgets are being allocated.
Because of this adjustment, AppsFlyer cautioned that the 2026 power rankings should not be directly compared with those from previous years. Volume rankings, however, remain comparable.
The full Performance Index also includes regional and category-specific rankings across 11 regions and up to ten app genres and categories, alongside remarketing rankings and a Creative Index examining advertising formats such as gameplay videos, user-generated content and animated creatives.
The findings show that mobile advertising leadership continues to vary significantly by platform and app category. While Google Ads maintains the leading position across Android, AppLovin and Apple Ads occupy the top spots in iOS gaming and non-gaming, respectively. The results also highlight the growing role of OEM networks and differences between advertising scale and AppsFlyer’s spending-based performance rankings.

Comments
Loading…